Dear Valued Partners,
As we conclude the third quarter of fiscal year 2026, I am pleased to share an update on the continued momentum of San Antonio's visitor economy. This quarter reflects the strength of our collaborative efforts as we welcomed more leisure visitors, major sporting events from the NBA Playoffs and Finals, and impactful meetings and conventions.
June and July have shown measurable growth compared to last summer, reflecting the success of our focused strategies. In August, incremental growth is expected, as travelers book last-minute summer getaways. As we close our fiscal year Q4, we continue to advance initiatives that drive visitation and economic impact.
Also, my deepest congratulations to our Board members Nicola Blaque, Krystal Jones, Loris Menfi, and Jiwon Choi Song for winning the San Antonio Business Journal’s 2026 Class of Women's Leadership Award. You are true leaders not just in our industry but the city and I am so grateful you are part of our Board and serve as valued advisors to Visit San Antonio.
Finally, thank you to the Visit San Antonio and TPID Board of Directors, hotel community, and industry partners for your continued partnership, investment, and commitment to our shared mission of bringing the world to San Antonio. As we approach expansion talks for the Convention Center and Sports & Entertainment District, we encourage you to contact your local elected officials and participate in City Council meetings and Citizens to Be Heard in support of this critical development. While one voice can start the conversation, many voices mark a movement.
With warm regards,

Mario J. Bass
President & CEO
Visit San Antonio

Visit San Antonio Q3 Performance
Back to Top of List| Goal | FY26 | Q3 Production | % of YTD Goal | % Variance to Q3 FY25 |
| Sales: Events Booked |
800 | 212 | 76.9% | +17% |
|
|
950.0K | 230K | 74.9% | +27% |
| Sales: Leads Generated |
3.6K | 1.0K | 79.3% | +3% |
| Experience: Citywide Planners' Satisfaction Rate |
3.9 | 4.0 | 103% | 0 |
| Marketing: Paid Reach |
95M | 30M | 72% | -11% |
|
|
33 pts | 36 pts | 102% | +33% |
| Marketing: Attributed Visitors |
2.3M | 755K | 76% | +6% |
| Communications: Earned Media Value |
$34.4M | $4.3M | 87% | -67% |
| Membership: Total Membership |
870 | 970 | 111% | +12% |
| Membership: Retention Rate |
80% | 93% | 116% | +2% |
San Antonio Lodging Performance
Back to Top of ListHotel Demand (STR)
| April | May | June |
|
|
| Occupancy | 62.1% | 58.7% | 66% | 60.5% |
| Rate | $140 | $128 | $136 |
|
| RevPAR | $87 | $76 | $90 | $82 |
Short-Term Rentals
| April | May | June |
|
|
| Occupancy | 62.7% | 63.6% | 72.1% | 63.3% |
| Rate | $170 | $172 | $183 |
|
| RevPAR | $107 | $109 | $132 | $108 |
Overall Demand (Aggregate Lodging)
| April | May | June |
|
|
| Occupancy | 62.2% | 59.1% | 66.6% | 60.8% |
| Rate | $143 | $138 | $141 |
|
| RevPAR | $89 | $79 | $94 | $84 |
San Antonio's aggregate lodging market demonstrated improving momentum throughout the calendar year second quarter (VSA FY26 Q3). April began the quarter below the prior year, directly related to the NCAA Men's Final Four in 2025. Hotel Market performance strengthened through May and concluded with a solid June as group demand strengthened, and transient demand provided consistent support. San Antonio's hotel market and short-term rentals followed a parallel pattern, where demand increases in one, the other follows suit.
Overall, San Antonio hotels year to date are up 1.3% in occupancy, down 1.3% in ADR, resulting in a flat RevPAR; the central business district is up 5% in occupancy, down 3.1% in ADR and up 1.8% in RevPAR
San Antonio short-term rentals year to date are up 4.9% in occupancy, down 2.3% in ADR and up 2.5% in RevPAR. It is important to note that supply has reduced by 2.7%
Significant Destination Sales Future Bookings
Back to Top of List| Group | Dates Booked | Room Nights | Estimated Economic Impact |
| Association for Financial Professionals | Nov. 2029 | 20.5K | $11.5M |
| National Association for College Admission Counseling | Sept. 2030 | 14.28K | $8.2M |
| Austin Sports Center |
|
14.5K/event | $10M/event |
Destination Experience
Back to Top of List| Hosted Group Metrics | Q3 Total |
| Total Attendance | 169K |
| Total Room Nights | 241K |
| Estimated Economic Impact | $174M |
Key Quarterly Campaigns and Media Coverage
Back to Top of ListMarketing
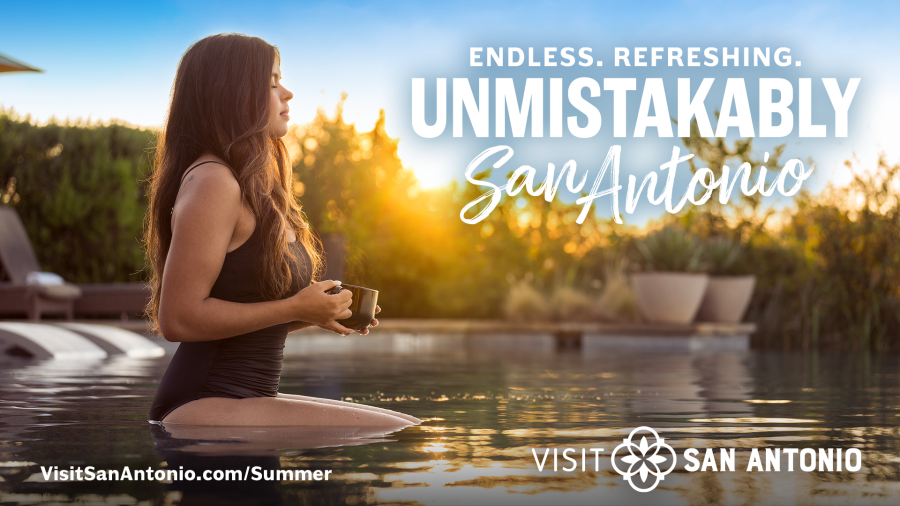
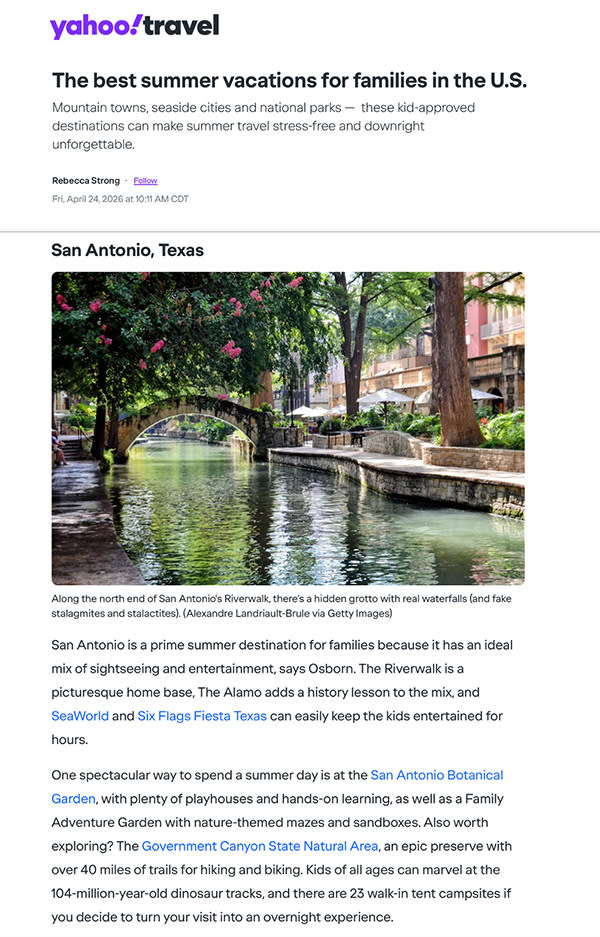
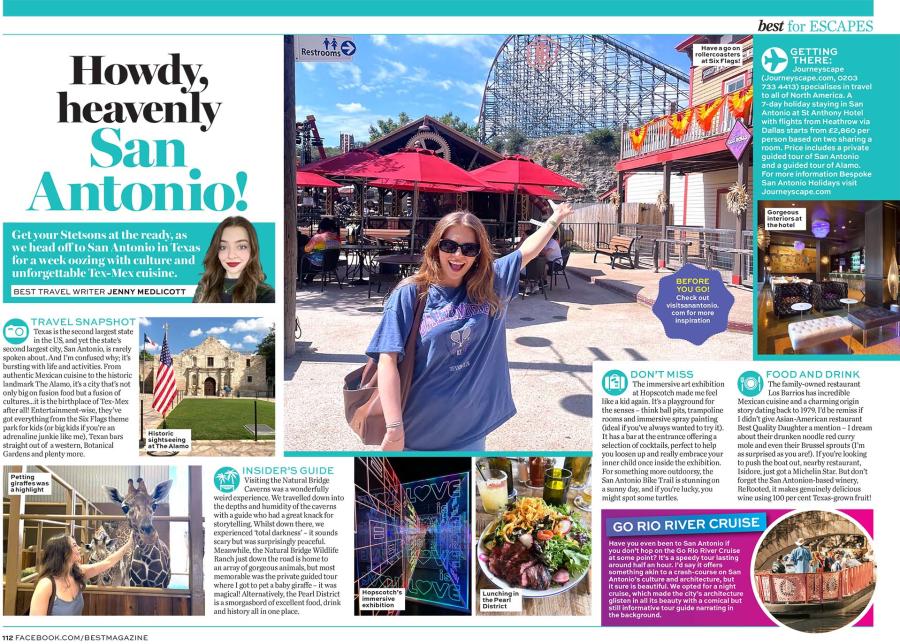
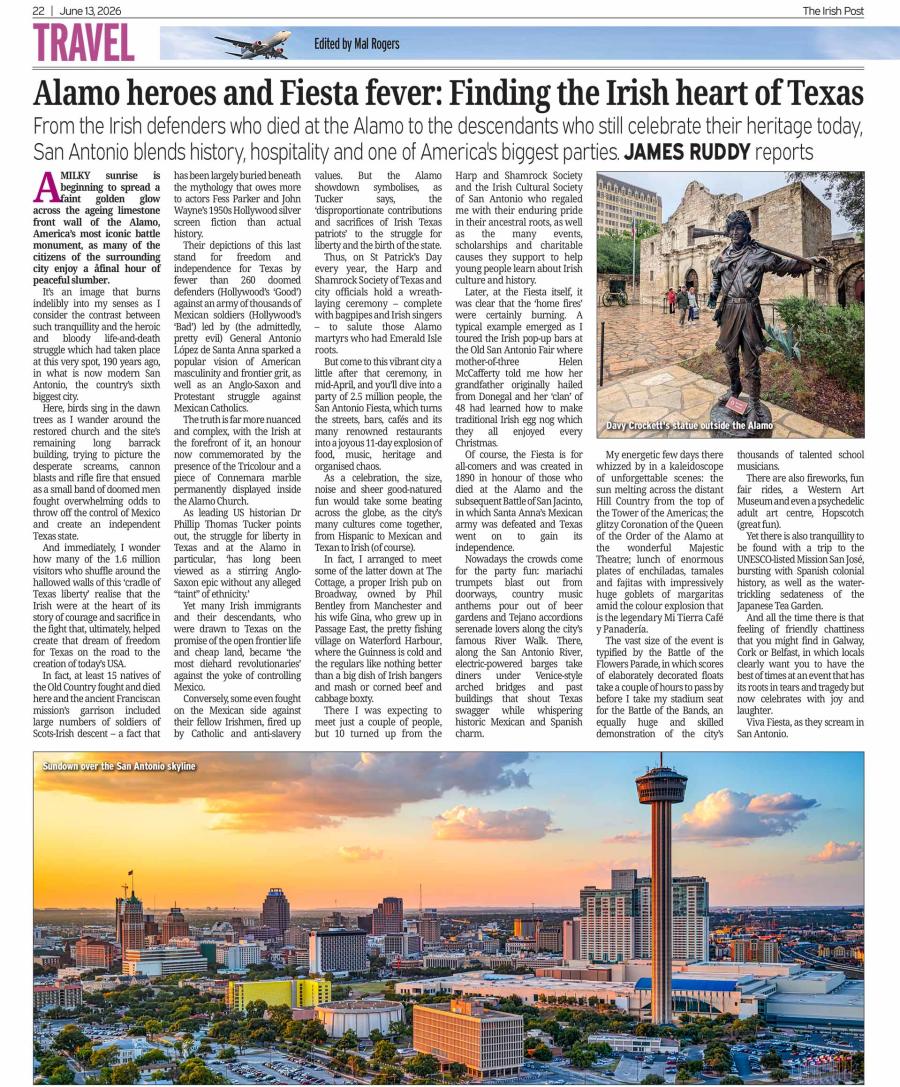
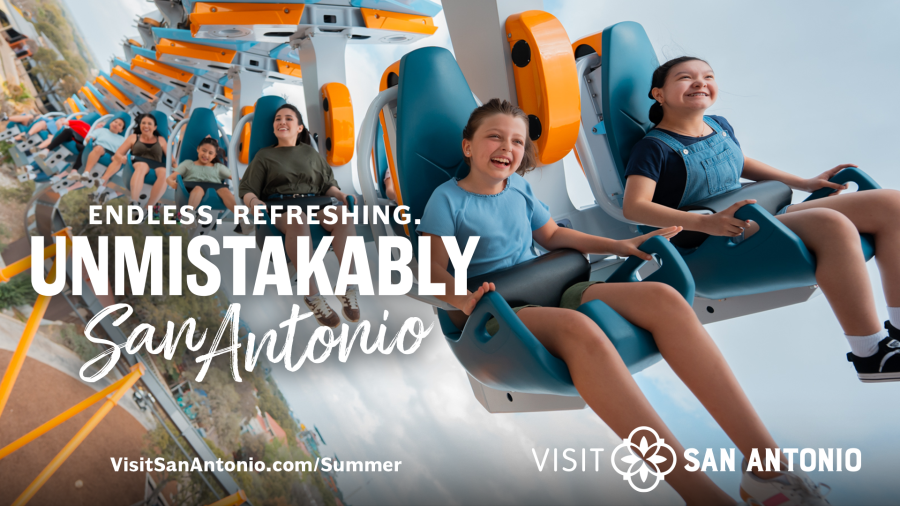
During the third quarter, Visit San Antonio executed an integrated portfolio of summer marketing campaigns that highlighted the destination's unique attractions, cultural experiences, family adventures, and major events to drive peak-season visitation. Complemented by strategic marketing support for San Antonio River Walk events through advertising, content, social media, and digital channels, these efforts strengthened destination awareness, generated strong audience engagement and reinforced San Antonio as an unmistakable summer destination.
Summer Campaign
Theme Park Capital of Texas®
San Antonio is Totally Wild!
World Cup Campaign
Leisure Development
Back to Top of List| Selling Channel | Campaign Dates | B2B or B2C | Investment | Room Nights Tickets Sold
|
Average Rate/Ticket Price | Total Revenue | ROI |
| Booking.com | Feb – Jul* | B2C | $75K |
|
$119 | $4.29M | 57:1 |
| Tiqets | Mar - Aug* | B2C | $20K | 12K | $29 | $348K | 17:1 |
| Hotelbeds (HB) | Apr - Jul | B2B | $20K | 25K** | $134 | $3.31M | 165:1 |
| TOTAL | Feb – Aug | B2B B2C |
$115K | 61K |
|
$7.48M | 69:1 |
*Staff negotiated two additional months with Booking.com and one additional month with Tiqets at no cost.
** Hotel Room Nights generated by the campaign.
***ATP is average ticket price.
To ensure we have year-round coverage with key selling channels for hotels and attractions, the initial round of campaigns from the Leisure Development short-term strategy kicked off in February and runs through August. While we continue to be impacted by several external factors, including the World Cup, weather, inflation, and gas prices, we have seen promising results.
Fall Campaigns will run from August through December. Key channels include Amadeus, Expedia, WebBeds, and ticket resellers.
We encourage members to take advantage of this FREE opportunity to leverage these campaigns and achieve individual revenue goals. Things to keep in mind:
-
Maximum Exposure
Member businesses may put their brand front and center on key channels. -
No cost to participate
The only requirement is an active contract with the selling channel. -
No mandatory discounts
Hotels/Attractions are promoted using rates already loaded in their individual system or previously negotiated. -
Full control remains with the hotel/attraction
Choose when to activate or deactivate channels based on individual business needs. -
Flexible pricing options
If a member chooses to offer special rates, adjustments can be made directly in their system or with the channel market manager.
River Walk
Back to Top of List| Event | Total Attendance | Resident* | Non Resident |
| Ford Mariachi Festival | 34.8K | 10.7K | 21.1K |
| Fiesta Artisan Show | 10.1K | 3.7K | 6.4K |
| Memorial Day Artisan Show | 23.6K | 6.2K | 17.4K |
| Pride River Parade | 40.4K | 18.8K | 21.6K |
| Summer Artisan Show | 17.6K | 4K | 13.6K |
*San Antonio DMA