Dear Valued Partners,
Spring is shaping up to be an exciting and optimistic season for our city. As the San Antonio Spurs continue their playoff run, there’s a real sense of energy building across San Antonio. From the influx of visitors to the national spotlight during home games, this moment is creating meaningful opportunities for our hospitality and tourism community. It’s driving business, elevating our visibility, and giving us all a chance to showcase what makes our city so special.
In this Q2 Executive Summary, we are highlighting a new metric that provides a clearer, more accurate view of occupancy in San Antonio. The new Total Lodging metric includes short-term rentals or Airbnbs, which account for nearly 10% of total lodging demand.
As we ride this wave of excitement, let’s remain focused on working together to make the most of these opportunities and, of course, cheering on our team. Go Spurs Go!
With warm regards,

Mario J. Bass
President & CEO
Visit San Antonio

Visit San Antonio Q2 Performance
Back to Top of ListSan Antonio Lodging Performance (YTD through March 2026)
Back to Top of List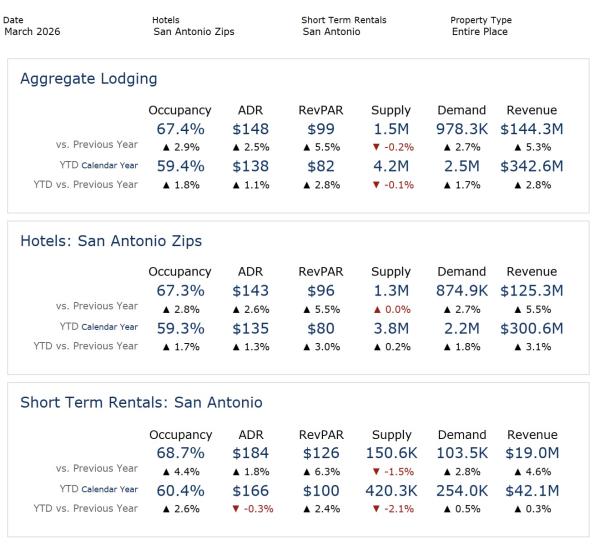
Transient led the way in occupancy over the spring break weeks, coming in second the first week and claiming the top spot the second week in our Texas cities’ competitive set.
The Visit San Antonio Fiscal Year Q2 (2026 Calendar Year Q1) for Hotels is up in occupancy by 1.7%, up in ADR by 1.3%, for an overall increase in RevPAR of 3%. San Antonio’s short-term rentals are also up in occupancy by 2.6% and RevPAR by 2.4%, seeing minimal loss of 0.3% in ADR. Aggregate Lodging wins for the January to March quarter of 1.8% in occupancy, 1.1% in ADR, and 2.8% in RevPAR.
Large Convention Sales Groups Hosted
Back to Top of ListDestination Experience
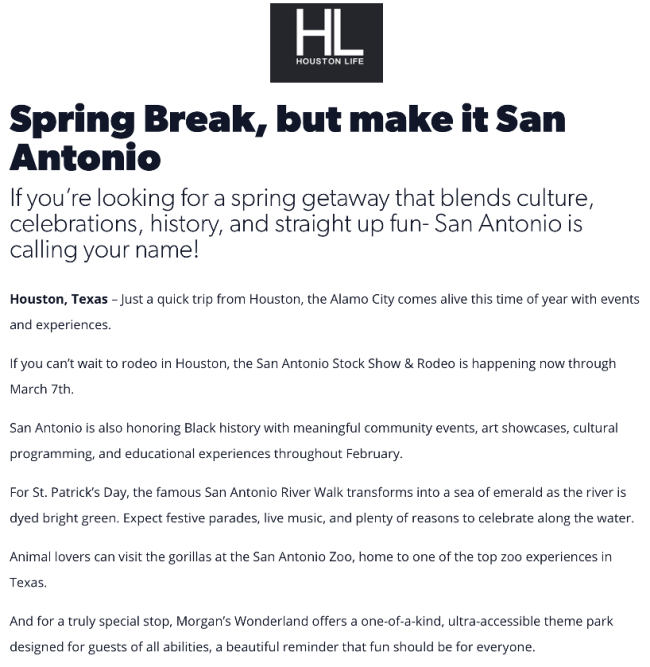
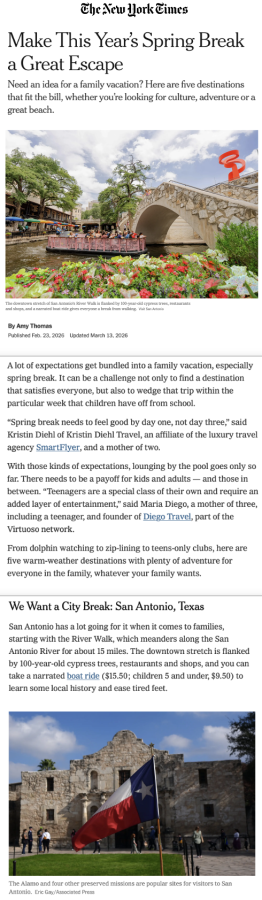
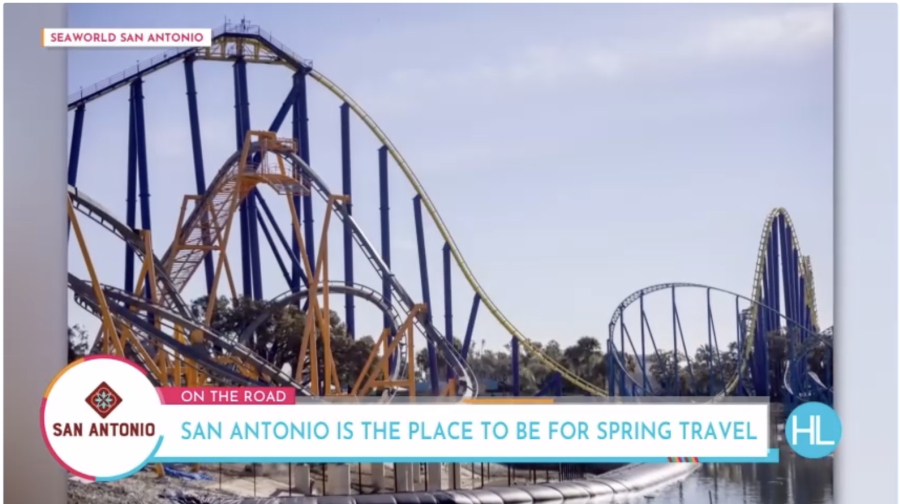
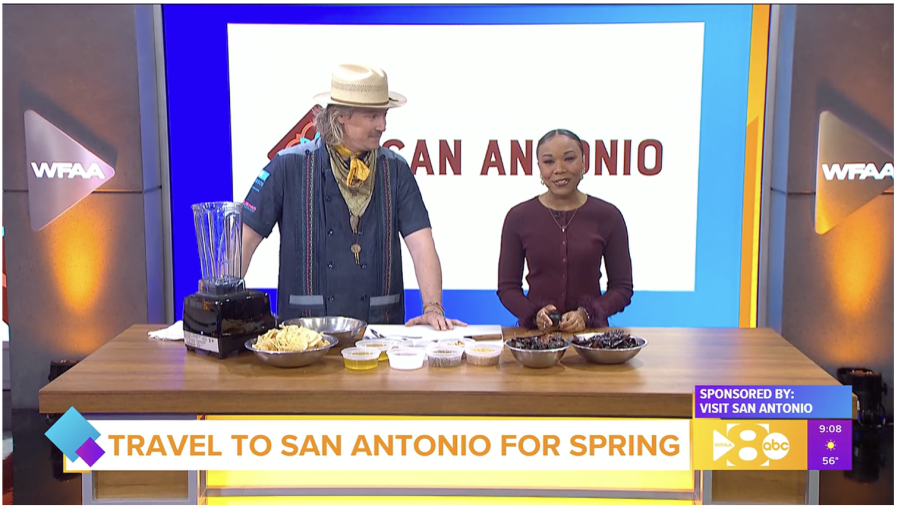
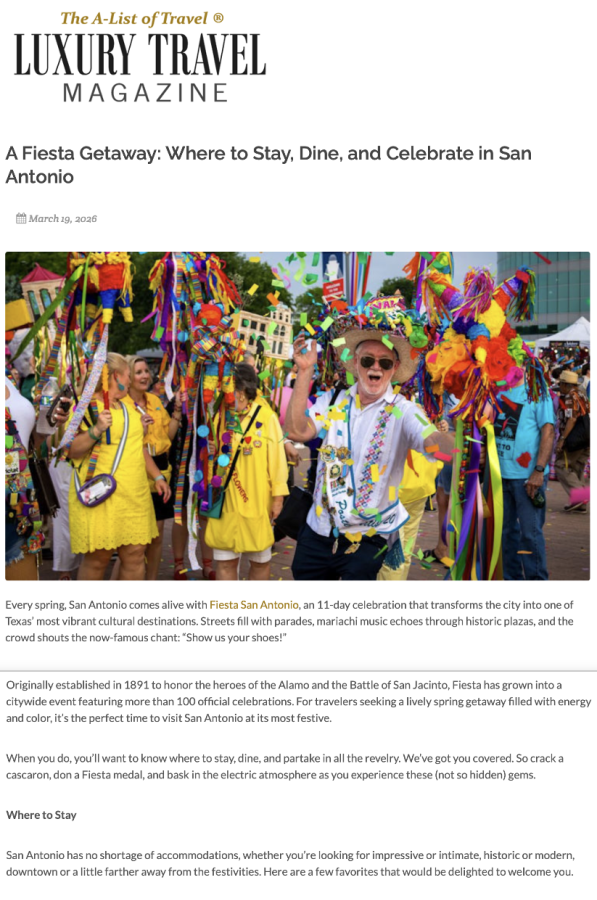
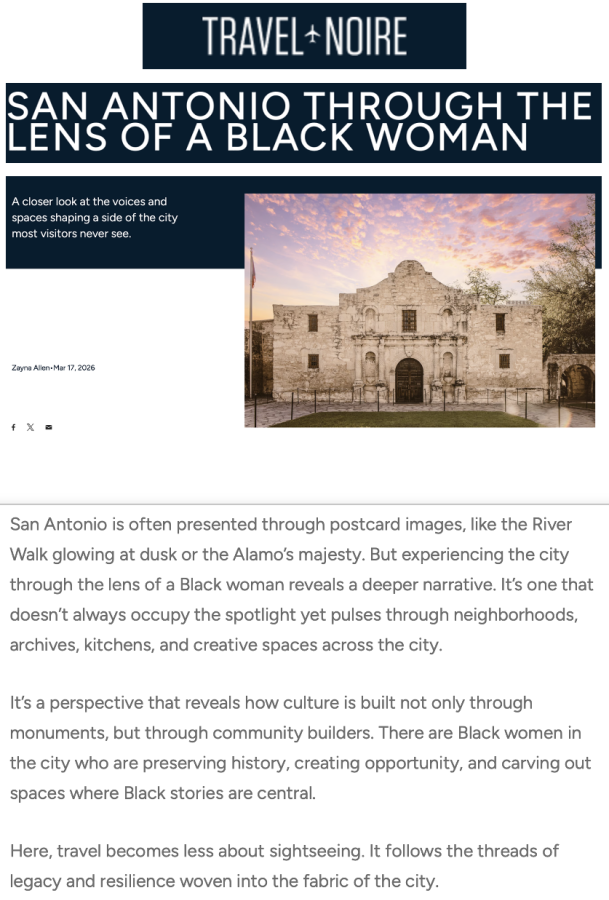
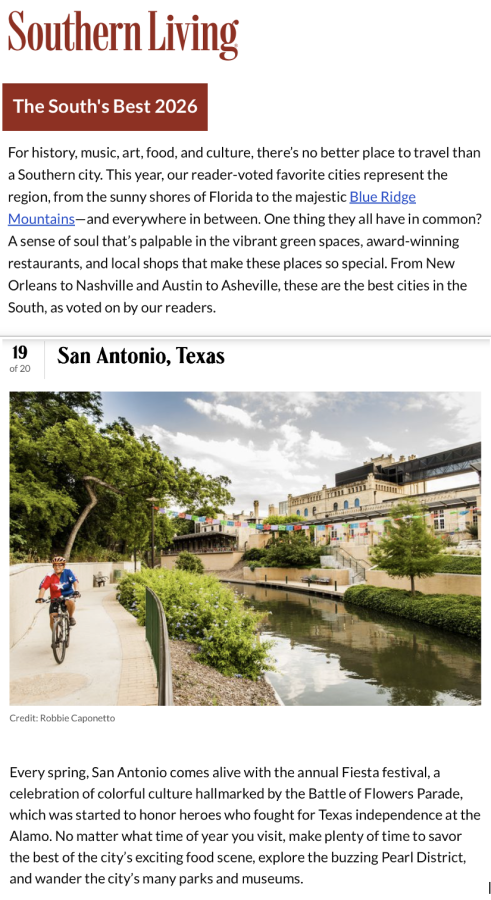
Back to Top of ListKey Quarterly Campaigns and Media Coverage
Back to Top of ListMarketing
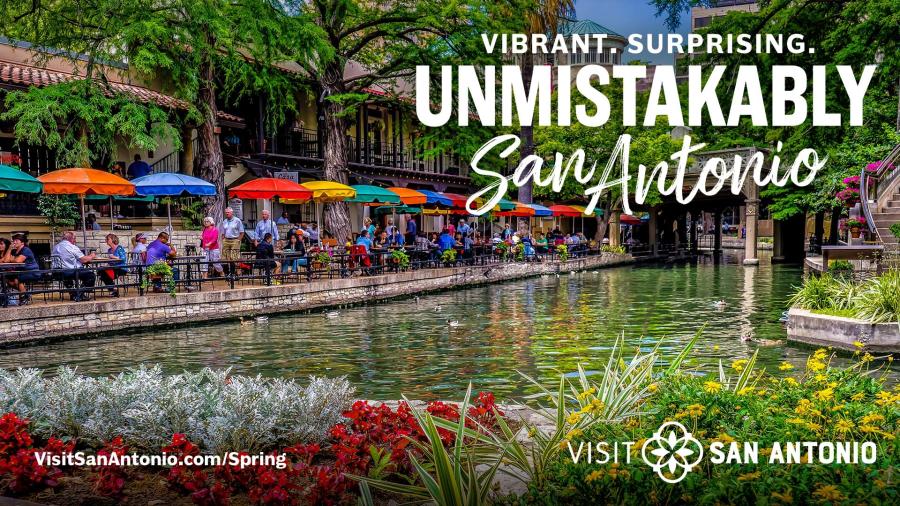
In Q2 FY26, Visit San Antonio’s marketing efforts continued to drive momentum and growth through integrated campaigns, strategic partnerships, and targeted content that elevated the city’s visibility across domestic and international markets. Winter and Spring campaigns, River Walk activations, and cross-platform storytelling increased engagement, expanded audience reach, increased visitation, and strengthened San Antonio’s position as a premier travel destination.
Winter Campaign
Spring Campaign